Comparison of rigid-plastic and elasto-plastic finite element predictions of a tensile test of cylindrical specimens – Post 2
페이지 정보
작성일posted onLink
본문
Comparison of rigid-plastic and elasto-plastic finite element predictions of a tensile test of cylindrical specimens – Post 2
In
this continuing post, the results of elastoplastic finite element analysis of
the tensile test will be presented.
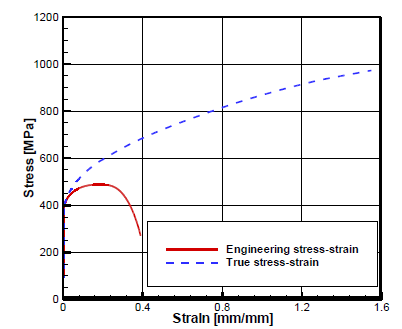
The
flow stress shown in Fig. 1, obtained by a material identification algorithm
based on rigid-plastic finite element method, was also employed for
elastoplastic finite element analysis of the tensile test. Modulus of elasticity
and Poisson’s ratio are assumed 201GPa and 0,3, respectively.
Predicted deformed shape of the tensile test specimen by the elastoplastic finite element method is shown in Fig. 2(b). It can be seen that it is very difficult to distinguish the predictions shown in Fig. 2(a)obtained by rigid-plastic finite element method from those shown in Fig. 2(b)obtained by elastoplastic finite element methods. Note that the material was assumed isotropic and to obey Huber-von Mises yield criterion, similarly to the rigid-plastic finite element method.
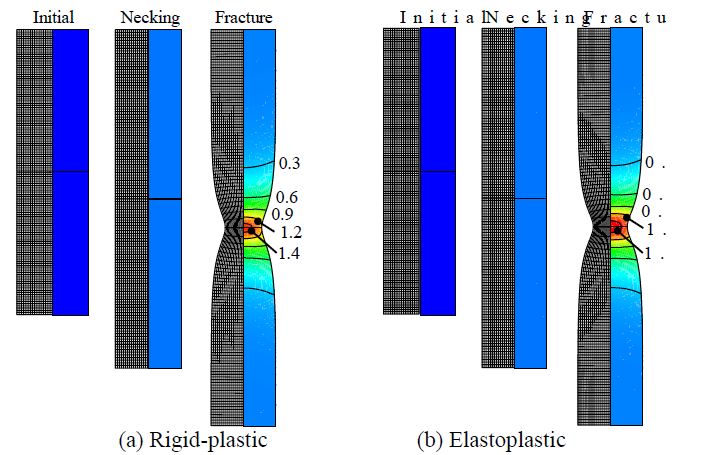
Figure
2: Predicted equivalent strain deformation history for the tensile test of
SCM435
As
shown in Fig. 3, tensile load and elongation obtained by the two approaches are
nearly the same as a whole especially near the necking point. However, more
in-depth investigation into Fig.4 reveals that elastoplastic finite element
solutions reflect the input modulus of elasticity of 210GPa for the strain less
than 0.001 while rigid-plastic finite element solutions cannot but causing
plastic deformation at the starting point due to its theoretical limitation. It
can be seen from Fig. 4 that the slope of tensile test predictions over the
strain ranging from 0.001-0.002 is about 185GPa, which is slightly different
from the input. Note it is due to a mere step size effect.
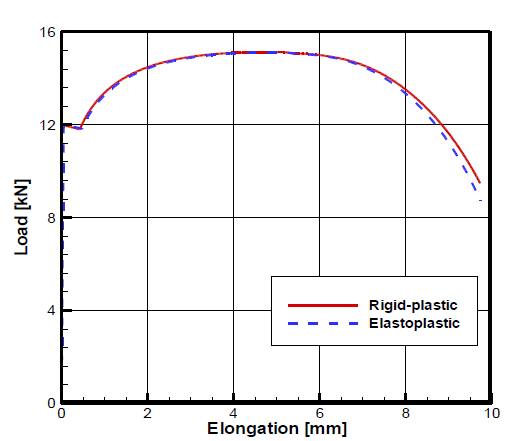
Figure
3: Comparison of tensile load-elongation curve between rigid-plastic and elastoplastic
finite element methods
In
addition, non-negligible difference between rigid-plastic and elastoplastic
finite element methods can be observed especially in the necking region just
before fracture point, that is, the difference in predicted tensile load
increases as the elongation approaches to the fracture point. As shown in Fig. 5,
the difference in predicted diameter at the necking point between the two
approaches reaches about 6%.
It
is very important to compare and evaluate the predictions obtained by the two
approaches for understanding the related theory and the related application-oriented
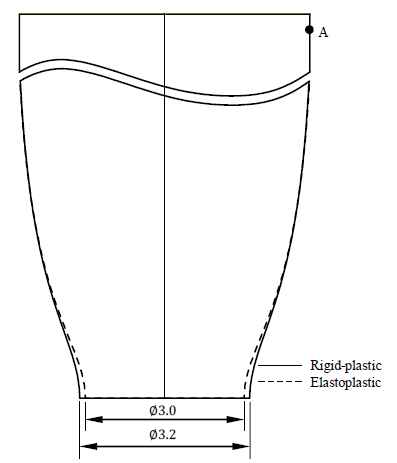
technologies. Thus, radius of point A as indicated in Fig. 5 was traced,
revealing that it increased by 0.0010mm in the case of elastoplastic finite
element method while it decreased by 0.0022mm in the case of rigid-plastic
finite element method. The former is owing to elastic recovery caused from the
decrease in tensile load while the former is due to numerical smoothing caused
from the assumption of rigid-plastic behavior of material [12]. However, the
difference is negligible compared with the radius difference of predicted tensile
test specimen, that is, 0.1mm. As shown in Fig. 6, the radius difference at the
necking point described in Fig. 5 is due to the radius difference over the
elastic region involving point A. That is, in the case of elastoplastic finite
element method, the elastic recovery in elastic region leads to relatively much
shrinkage at the necked region since the input elongations in the methods were
the same.
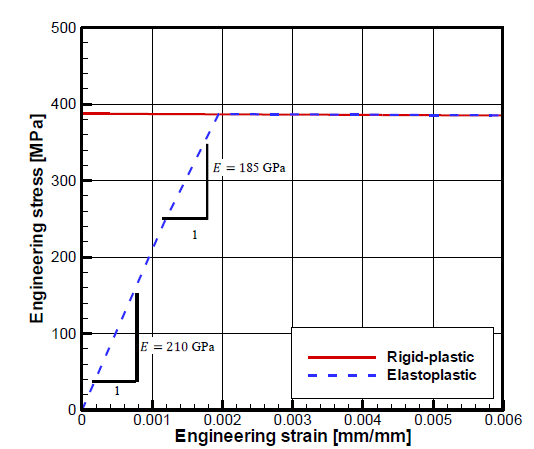
Figure
4: Detailed comparison of engineering stress-strain curve between rigid-plastic
and elastoplastic finite element methods
Figure
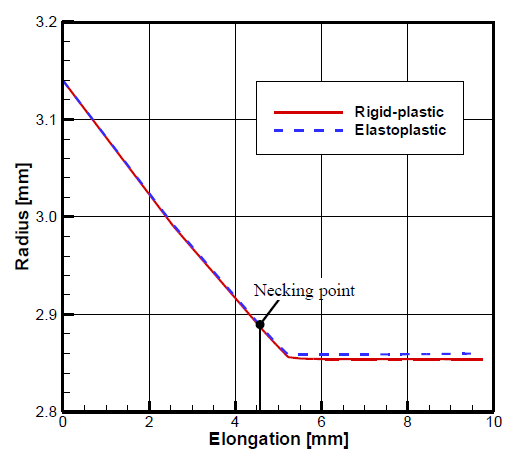
5: Comparison of deformed shape at the final elongation
Figure
6: Comparison of radius at the point A in Fig. 5 between rigid-plastic and
elasto-plastic predictions
It
is thus concluded that this radius difference shown in Fig. 5 is due to radius
increase caused from elastic recovery in elastoplastic finite element as shown
in Fig.6.It can be seen from Fig. 4 and Fig. 5 that it is not easy to specify a
necking point because the peak tensile force maintained for a certain time
interval in which the elongation increased steadily without change of tensile
force. Of course, this phenomenon is due to non-homogeneous deformation until
the necking point [13], that is, the major deforming region moves from place to
place due to numerical non-homogeneity and strain hardening effect even though
the necking phenomenon does not occur. This discussion reveals that the necking
point is the very end point of necking starting interval in which tensile force
is stationary, i.e., the peak strain remains while the deformation region moves
to the region with smaller strain.
Tensile deformation basically causes expansion of material and thus the total volume should increase in the case of elastoplastic finite element method. In fact, the volume increase rates were 0.001% and 0.01% in rigid-plastic and elastoplastic finite element methods, respectively. The former is negligible and meaningless because of the assumption of incompressibility in the theory of rigid-plasticity. Of course, its small value guarantees the reliability and validity of numerical schemes in the rigid-plastic finite element method. Note that the volume increase of elastoplastic finite element predictions are indispensable because mean stresses at any point are positive.
In the series of these 2 posts, experiments of a tensile test of cylindrical specimen ofSCM435 which was spheroidized to be forged were compared with predictions obtained by both rigid-plastic and elastoplastic finite element methods to reveal the similarity and difference of the two finite element methods.
It
was seen that two different finite element methods predicted nearly the same
solutions even though the tensile test is relatively sensitive to the theories
on which numerical approaches are based.
The
detailed investigation into the tensile load and deformed shape revealed more
or less difference between the two finite element methods, which caused from
the related theories. However, the difference can be acceptable, considering
that numerical simulation of a tensile test is very sensitive to numerical
schemes and conditions including finite element mesh, time step, minimum
allowable effective strain rate in the rigid-plastic finite element method and
the like.
Tensile
test simulation by the rigid-plastic finite element method is vulnerable
because the effective stress in the elastic region just after the necking point
is quite high, which causes artificial numerical deformation in the elastic
region. However, since the rigid-plastic finite element method is more
pragmatic in most cases, the knowledge drawn from the comparison between
rigid-plastic and elastoplastic finite element method are very meaningful for
the process design engineers to get more valuable information from the predictions
by the rigid-plastic finite element method.
References
[1]
Bridgman P.W.:Studies in large flow and fracture, McGraw-Hill, New-York, 1952.
[2]
ZhangK.S.:Fracture prediction and necking analysis,Eng.Fract.Mech.52 (1995)
575-582.
[3]
Komori K.:Simulation of tensiletest by node separation
method,J.Mater.Process.Technol.125-126 (2002) 608-612.
[4]
MironeG.:A new model for the elastoplastic characterization and the
stress-strain determination on the necking section of a tensile specimen,Int.
J.Solids.Struct.41 (2004)3545-3564.
[5]
Springmann M., KunaM.: Identification of material parameters of the
Gurson-Tvergaard-Needleman model by combined experimental and numerical
techniques,Computational Materials Science 32 (2005) 544-552.
[6]
M. S. Joun, J. G. Eom, M. C. Lee:A new method for acquiring true stress-strain
curves over a large range of strains using a tensile test and finite element
method, Mechanics of Material40(2008) 586-593.
[7]
J. G. Eom, Y. H. Son, S. W. Jeong, S. T. Ahn, S. M. Jang, D. J. Yoon, M. S.
Joun:Effect of strain hardening capability on plastic deformation behaviors of
material during metal forming, Material and Design54(2014)1010-1018.
[8]
C. H. Lee, S. Kobayashi: New Solutions to Rigid-Plastic Deformation Problems
Using a Matrix Method, J. Eng. Ind. 95 (1973) 865-873.
[9]
M. C. Lee, S. H. Chung, S. M. Jang ans M. S. Joun: Three-dimensional simulation
of forging using hexahedral and tetrahedral elements, Finite. Elem. Anal. Des.,
45 (2009) 745–754.
[10]
W. J. Chung, M. S. Joun:Elastoplastic module of AFDEX 2D, Proc. of 2013 KSTP
AutumnConference(2013)57-60.
[11]
J. R. Hughes:The Finite Element Method:Linear Static and Dynamic Finite Element
Analysis,Prentice-Hall, New Jersey, 1987.
[12]
M. S. Joun: Case study on major defects in cold forging by finite element
method (1) –Accuracy of forging simulation, KSTP Autumn conference(2011)
223-227.
[13]
M. S. Joun, I. S. Choi, J. G. Eom, M. C. Lee:Finite element analysis of tensile
testing with emphasis on necking,Computational Materials Science41(2007) 63-69.